Daily Position Report
PNL Changed (System Time 4/15 00:00- 4/15 23:50) Total PNL During the Day
Clients’ Loss was around 2.400 mio ten mins ahead of the EOD.
Intraday Client PNL
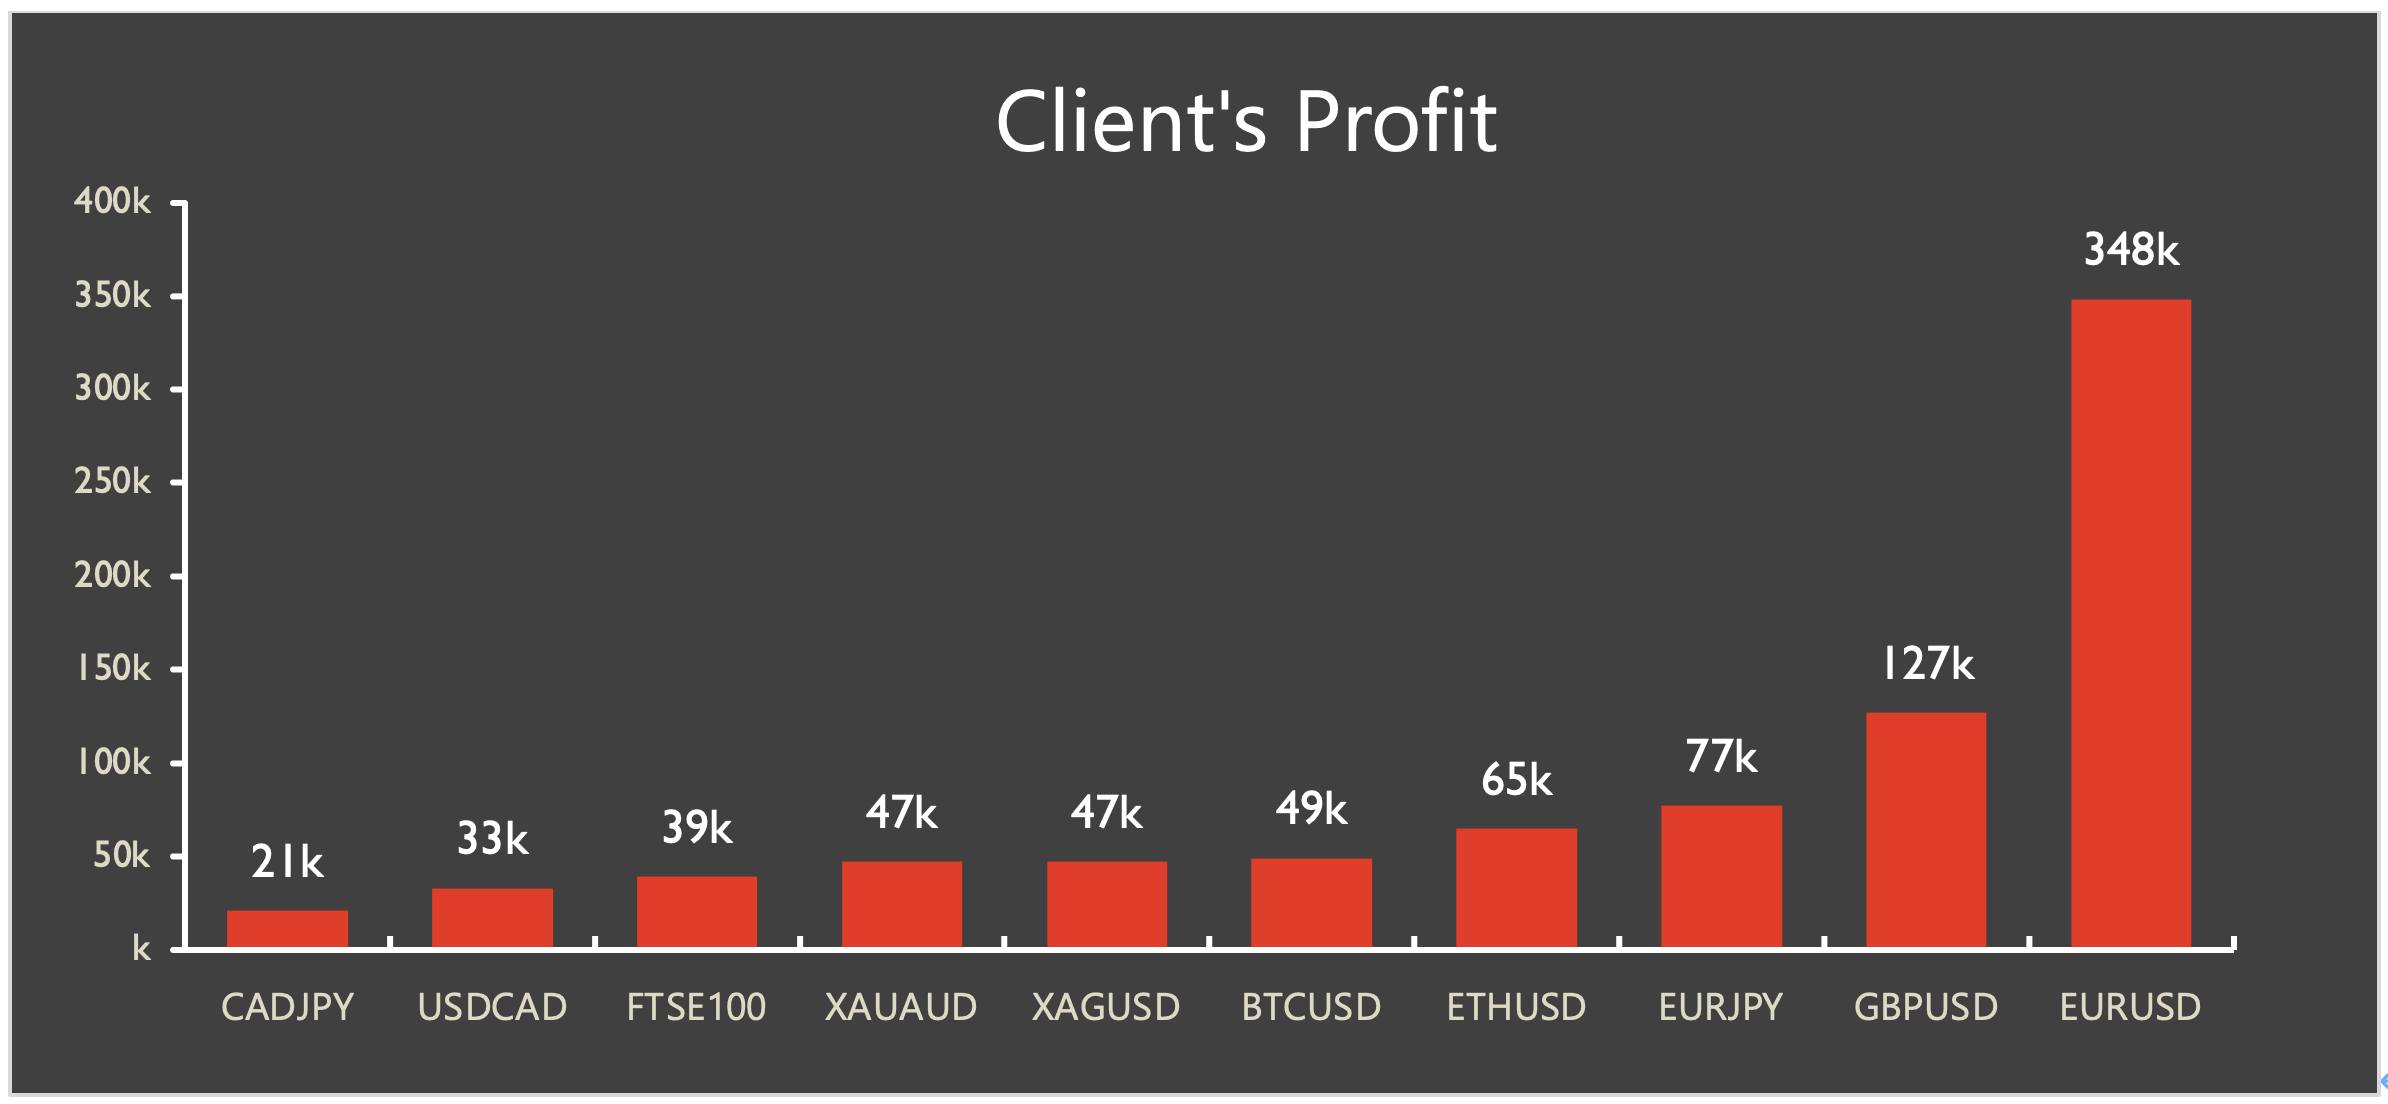
Clients Profit
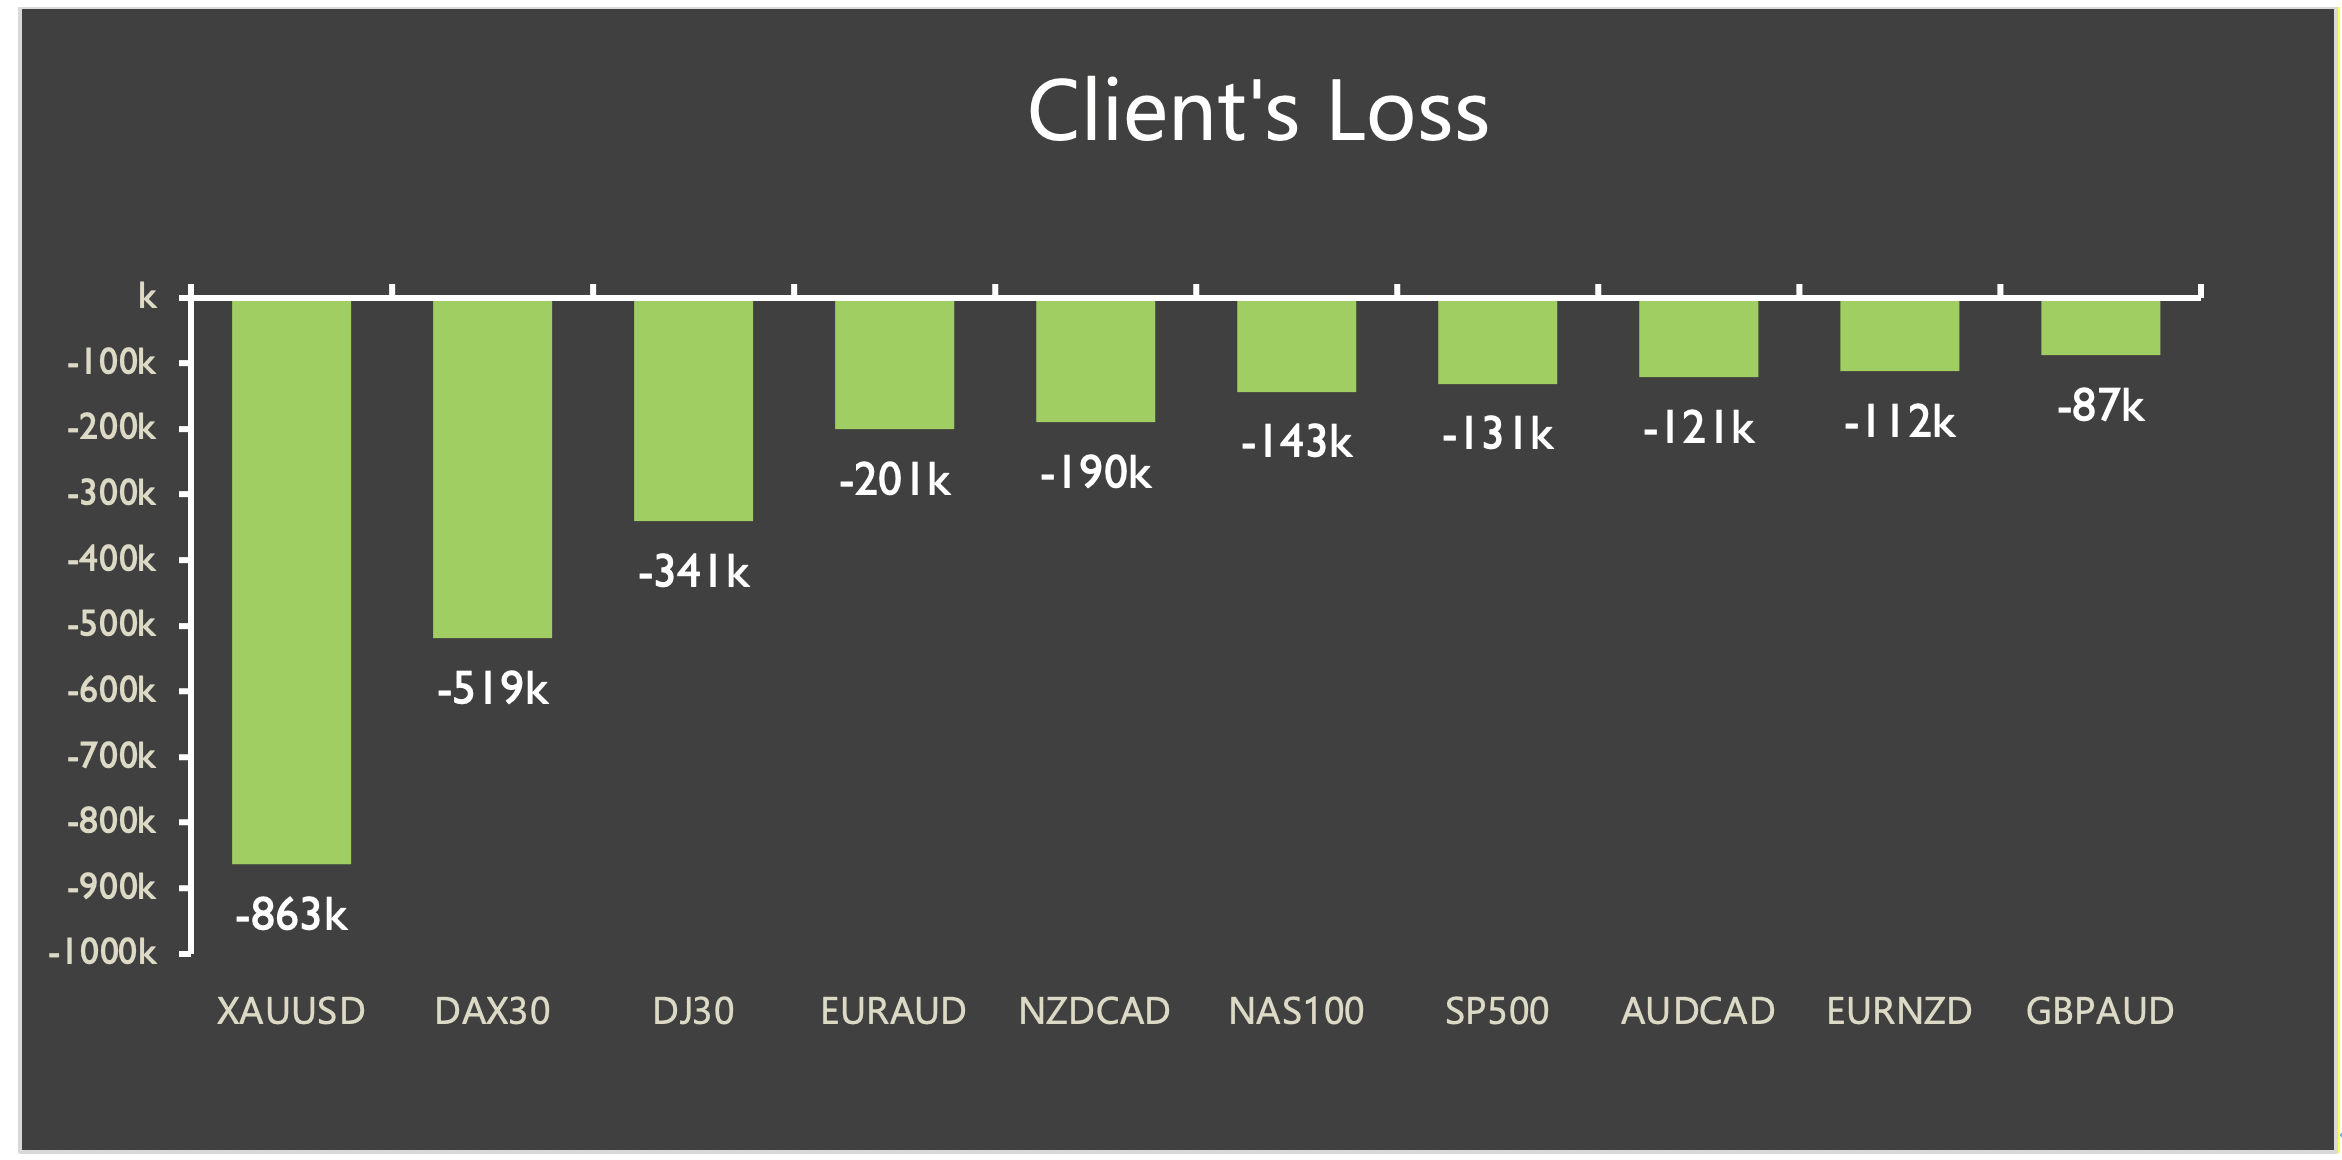
Clients Loss
Client Net Position
BOOK Exposure & Top PNL at EOD
Market Focus
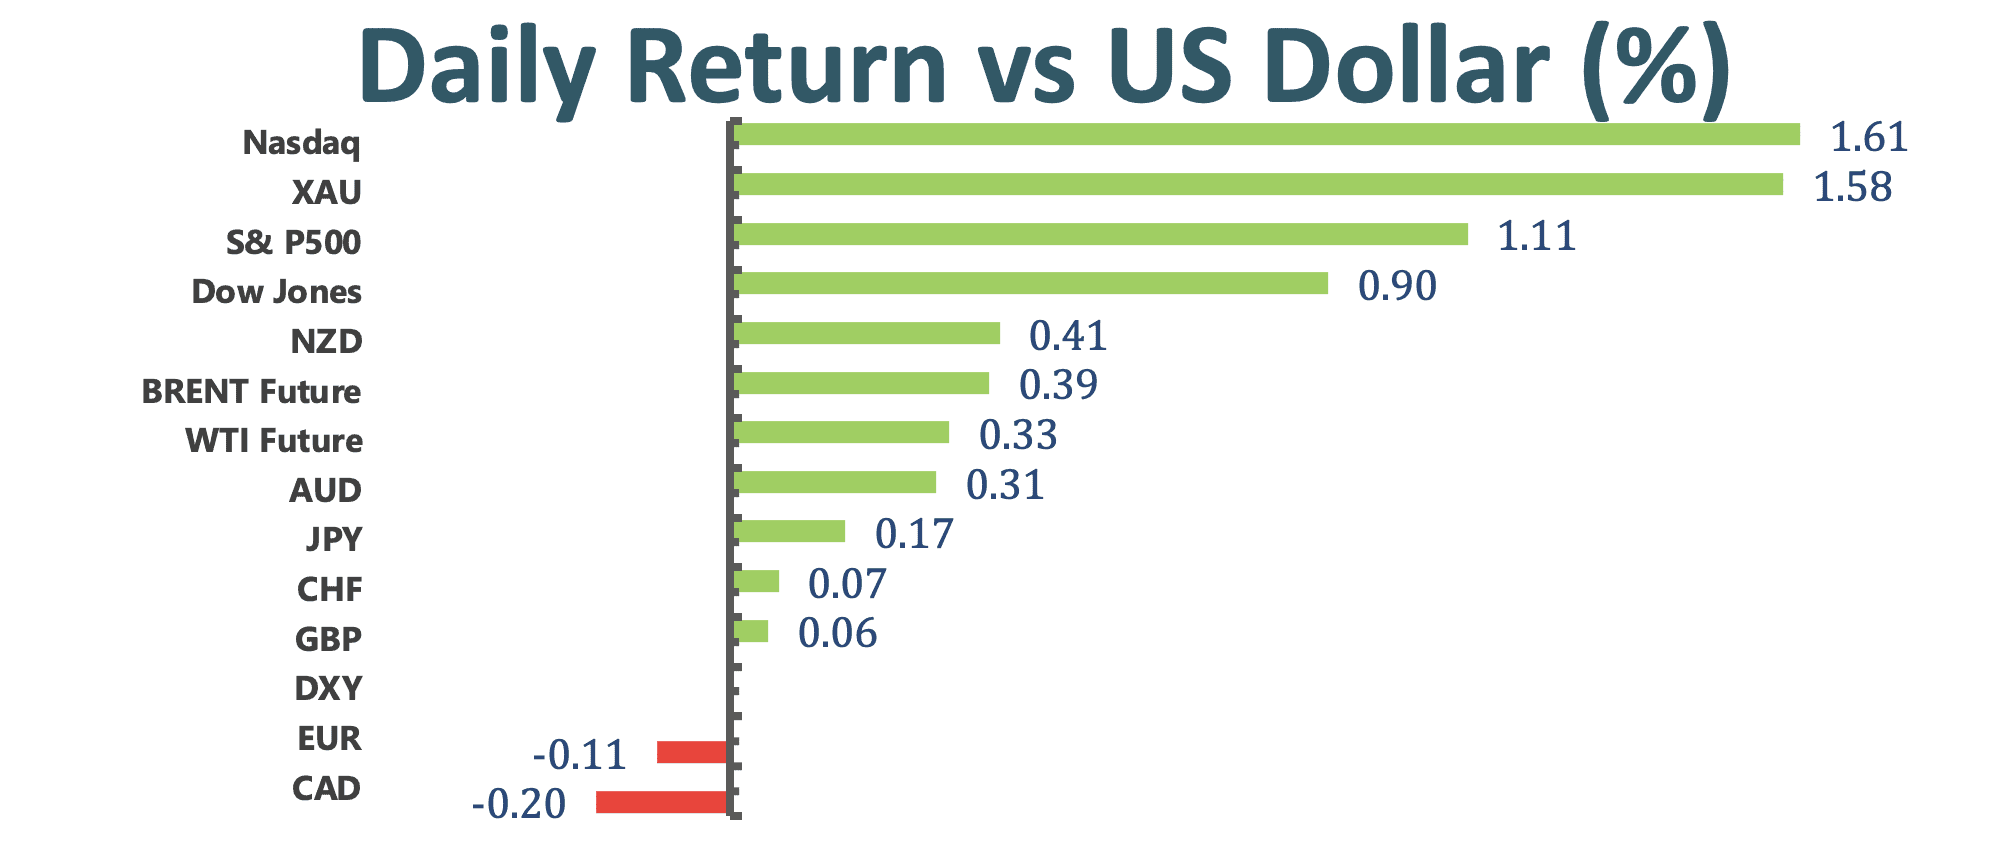
US equities market climbed to record highs with weekly unemployment claims data and retail sales signaling a speedy recovery in the US. At the same time, the US yields declined the most since February. High expectations of a strong economic recovery, combined with optimism over fiscal stimulus and monetary policy, have boosted US equities to record high. All told, the Dow Jones Industrial Averages surged 270 points; the Nasdaq advanced 1.1% and the S&P500 climbed 0.9% today.
European stocks hit a fresh record high as the pan- European Stoxx 600 climbed to a high of 438.29 today, 55% jump from a pandemic low. European equity markets are set to benefit from an acceleration in euro area GDP growth over the upcoming months after the reopening and the recovery in the US. And the expectation for next year is that market earnings estimates are forecast to be above 2019 levels.
As the US bond yields declined today, investors signaled fresh concerns about when banks are going to get back to their original business, which is money lending. Bank of America has reported that there is a 14% decline in loan balance whilst Citigroup also mentioned that its loans tumble around 10%. Concerns are that whether the country’s biggest banks can meaningfully increase lending contributed to share- price declines today with Bank of America slumping as much as 4.6%.
Market Wrap
Main Pairs Movement:
The precious metal, gold has been on a roll, benefitting from the decline in returns on the US bond yields. At the same time, the US dollar weakened after the US retail sales accelerated in March by the most in 10 months as businesses gradually reopen.
Aussie on the road to higher level, eyeing on 0.7800 amid upbeat Australian data and risk appetite. AUD got power up since NAB March business conditions hit a record high, Westpac April consumer sentiment reached a 10 year high and job creation yet again smashed in March. According to NAB, hours worked are officially above pre- pandemic levels. As a result, AUD is in a very strong stance.
GBPUSD traded in a tight range as there is lack of catalysts to move. Overall, GBPUSD edged up 0.1% today.
Technical Analysis:
EURUSD (Daily Chart)
After EURUSD penetrated 1.1945 level, it well stablizes above the support. The near- term outlook is bullish as the pair has outbreached yearly resistance at 1.1945. At the same time, the pair has climbed above the 50 SMA, opening up a path for EURUSD to accelerate its bullish momentum further north toward the next resistance at 1.2070 and the 100 SMA. Both technical indicators continue to support EURUSD’s bulls as the MACD remains its bullish signal while the RSI is still out of the overbought territory, giving the pair rooms to climb up.
Resistance: 1.2070, 1.2349
Support: 1.1945, 1.1695, 1.1492
USDJPY (Daily Chart)
USDJPY continues to seek downside continuation on the daily chart. As equities rally in Europe, the US dollar faces the pressure against safe- haven rivals, Japanese Yen. The pair looks poised to extend its slide further south as it breaks below the support level at 109.45 as well as the midline of Bollinger Band. Additionally, the pair has officially broken the ascending trend, opening up a downside acceleration toward the next immeidate support at 107.87. At the same time, the RSI is still far from the oversold region, indicating that there are still rooms for USDJPY to decline.
Resistance: 109.45, 111.40
Support: 107.87, 106.29, 104.34
XAUUSD (Daily Chart)
Gold surges above $1760 level amid slumping US bond yields. Gold has eventually broken through its resistance at $1746.91, turning bullish in the near- tern. The technical indicator, RSI is outside of overbought territory in the daily chart, giving the pair rooms to extend further north; in the meantime, the MACD continues to signal a positive move, lending supports to bulls. As of now, gold eyes on the next immediate resistance at $1774.51, where is a critical level as it behaves as a yearly resistance and it is the upper band of Bollinger band; That being said, gold is possibly going to confront selling pressures at this level, subjecting an adjustment.
Resistance: 1774.51, 1790.23, 1825.24
Support: 1746.91, 1676.89
Economic Data
|
Currency |
Data |
Time (GMT + 8) |
Forecast |
||||
|
CNY |
GDP (YoY) (Q1) |
10:00 |
19.0% |
||||
|
CNY |
Industrial Production (YoY) (Mar) |
10:00 |
17.2% |
||||
|
EUR |
CPI (YoY) (Mar) |
17:00 |
1.3% |
||||
|
USD |
Building Permits (Mar) |
20:30 |
1.750m |
||||


