Daily Market Analysis
Market Focus
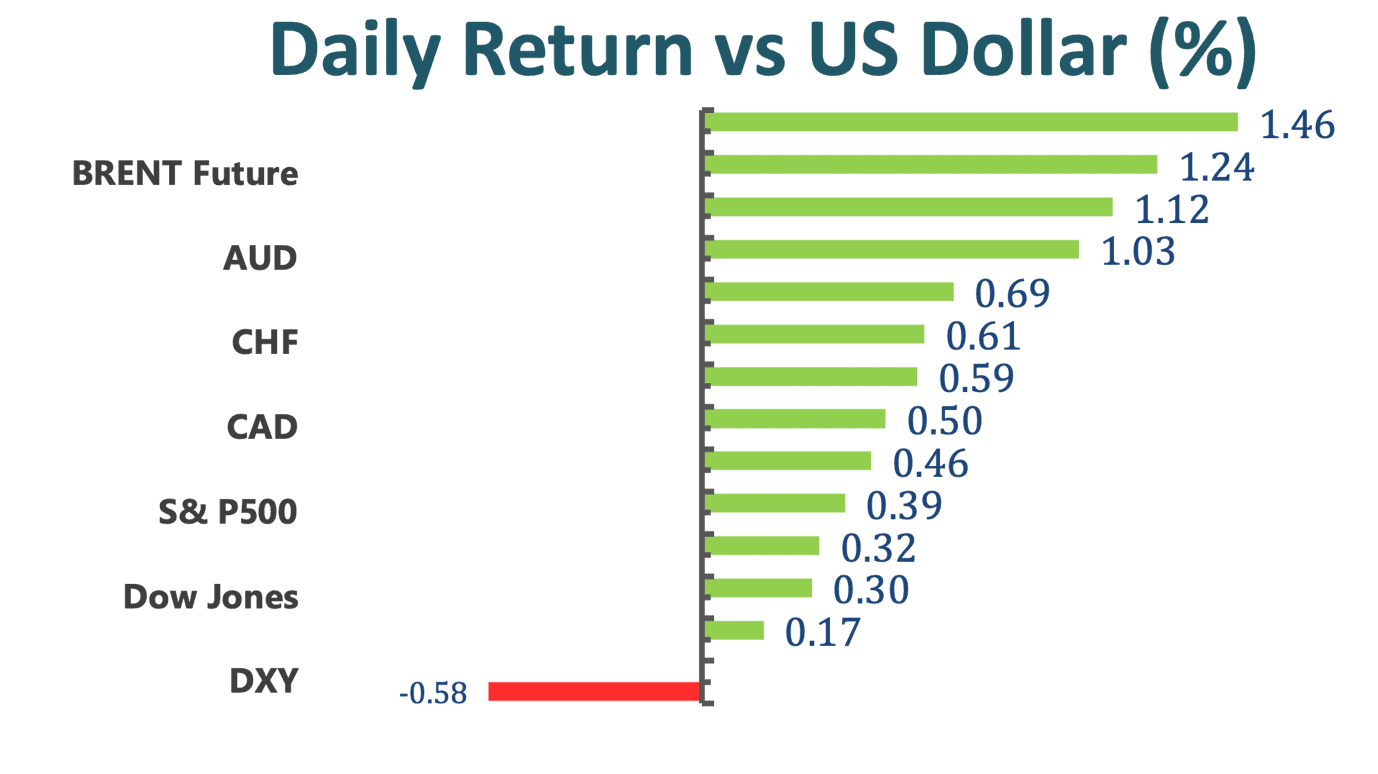
Stocks extended their weekly rally after weaker-than-forecast US jobs data bolstered the case for President Joe Biden’s $1.9 trillion coronavirus relief package. The dollar fell.
The House adopted the budget resolution that cleared the Senate early Friday, paving the way to pass a stimulus bill with only Democratic votes. The S&P 500 climbed to another record in its best week since Nov as every major group, but technology rose. The surge in GameStop Corp. after Robinhood Markets Inc. removed limits on buying the stock did little to repair the videogame retailer’s weekly plunge of 80%. Two-year Treasury note yields matched an all-time low amid a drop across shorter-dated rates.
The recovery in the U.S. labor market disappointed for a second month as modest job growth highlighted the persistently difficult prospects for millions of unemployed Americans. Nonfarm payrolls increased by just 49,000 after a downwardly revised 227,000 Dec decline. President Biden gave the strongest indication yet he’ll push for stimulus without Republican support, saying Friday’s weak economic data show the risk of doing “too little”.
In corporate news, Pinterest Inc. surged as the digital scrapbooking and search company reported sales that topped estimates. In the meantime, Peloton Interactive Inc. sank after saying it can’t keep up with surging demand for its exercise machines and warning that profit will be squeezed.
Market Wrap
Main Pairs Movement
EURUSD is trading around 1.20, up from the lows after the US reported an increase of only 49,000 jobs in January, worse than expected. Investors are eyeing stimulus news from Washington.
USDJPY ran into a widely tracked technical resistance on Friday. The pair tested the 200-Day SMAVG for the first time since June 2020. The SMA located at 105.59 was breached with a move to 105.64, however, the breakout was short-lived.
The AUDUSD is having on Friday the best day in weeks boosted by a broad-based slide of the US dollar and also on the back of a recovery of the aussie. The pair is about to end the week hovering above 0.7665, at the highest level in a week.
It’s been a rough end to what would otherwise have been an excellent week for the US dollar. After soft NFP data, the DXY has fallen all the way back to the key 91.00 level.
WTI is having a strong finish to the week, having rallied as high as $57.00 on Friday. Higher stock prices, US bond yields, and a lower US dollar are all providing tailwinds to the crude oil complex.
Technical Analysis:
GBPUSD (Four-hour Chart)
GBPUSD advances above the 1.3700 price zone and is trading comfortably around 1.3730 at the time of writing. Given that the US economy only gained 49K new jobs, which is below the market expectation, this Non-Farm Payrolls reading undermines the demand for the greenback and gives a boost to the GBPUSD bulls. From a technical perspective, a bearish pressure continues to be supported by the 60-Day SMAVG, but with the recent advances of the Cable pair, a golden-cross is staging. Consider the BoE has dished out hawkish signals on Thursday and the continuation on vaccine rollouts, the bullish trend of GBP is likely to extend. Not to mention the fact that the RSI is currently hovering around 60, indicating there is still room for the pair to advance. If the Cable can find acceptance above the 1.3740 resistance, the next resistance can be seen around 1.3760. On the flip side, if the Cable reverses its ongoing upward momentum, the most immediate cushion is 1.3657, then 1.3606, followed by 1.3568.
Resistance: 1.3740, 1.3761
Support: 1.3657, 1.3606, 1.3568
USDCAD (Four-hour Chart)
After successfully breaking the 3-month bearish trend on 1/27, the Loonie pair has been trading between in a confined range within 1.2835 and 1.2765.
On the last day of the week, the Loonie dipped low despite a disappointing Canadian labour market data as the strength in crude oil and the worse-than-expected US labour data supported the CAD and reversed the bullish trend of the pair, which subsequently pulled the pair back down to around 1.2765 at the time of writing. Technically speaking, the 15-Day SMAVG is supporting the USDCAD, but the 40s RSI is suggesting the market is currently tilted to the seller’s side. If the Loonie can break below 1.2765, the next cushion would be 1.2741 and 1.2714. Conversely, when the pair resumes its bullish run, the buyers must find acceptance above 1.2803 before further advancing towards 1.2835.
Resistance: 1.2803, 1.2835, 1.2873
Support: 1.2765, 1.2741, 1.2714
XAUUSD (Four-hour Chart)
Bouncing back from the three-consecutive day loss, the yellow metal finally regained some upward momentum on Friday, reclaiming $1812 at the time of writing. After the downbeat US labour data was released, the Gold regained some positive traction. However, if the precious metal fails to break above the $1812, the bearish pressure on XAUUSD could persist as indicated by both the MACD and 60-Day SMAVG. Looking ahead, the US Consumer Price Inflation numbers for Jan and a speech from Fed Chair Powell in the upcoming week are closely eyed. If the precious metal can find acceptance above $1812, the next resistance can be found at $1825 and $1834. On the flip side, if the bears outplay the bulls, the most immediate support is seen at $1789, then $1769.
Resistance: 1812, 1825, 1834
Support: 1789, 1769
Economic Data
Click here to view today’s important economic data.


