Daily Market Analysis
Market Focus
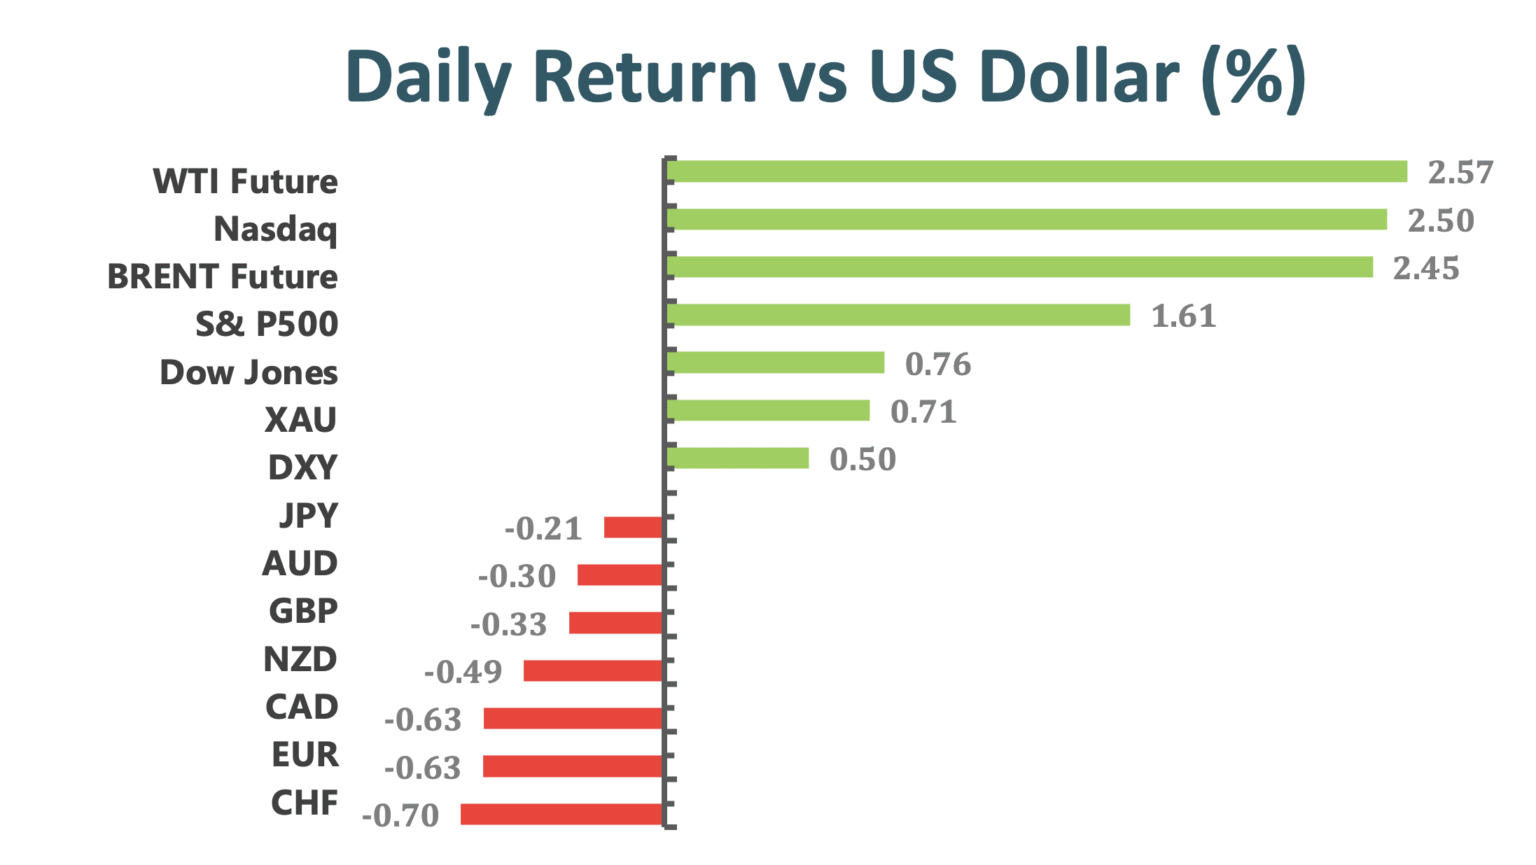
Stocks had their biggest rally in about 10 weeks as several strategies said the recent explosion of speculative buying won’t derail the bull market in equities. In a broad-based advance led by retailers and tech companies, the S&P500 rebounded from last week’s rout as the Nasdaq 100 jumped 2.5%. Amazon.com Inc. and Alphabet Inc., which are set to report earnings Tuesday, climbed at least 3.6%. Tesla Inc. soared after an analyst more than doubled his price target on the electric-car maker, claiming “fireworks aren’t over.” GameStop Corp. tumbled as bearish investors appeared to cover their positions while retail traders flocked to other corners of the market. Silver climbed to an almost eight-year high.
The battle between retail traders and hedge funds is unlikely to cause a significant setback for markets, according to JP Morgan Chase & Co. Major drawdowns have usually occurred when there’s a worse outlook for growth, as well as signs of overvaluation beyond price-earnings rations and credit spreads. Few markets show signs of extraordinary price momentum or excessive leverage.
Market Wrap
Main Pairs Movement
EURUSD pair bounced from the 1.2060 region but fails to break above 1.21. The dollar eases slightly as equities stage a modest comeback as retail investors’ frenzy temporarily cooled. Aussie, on the other hand, finished Monday nearly unchanged as the pair is trapped between the greenback’s demand and rising equities. RBA is expected to keep the monetary policy on-hold, and the market is eyeing its rate decision to be released on Tuesday. USDCAD is higher by around 0.4% on Monday, having rallied from late Asia Session lows in the 1.2760s to current levels in the 1.2820s, up around 50 pips from last Friday’s closing levels in the 1.2670s.
DXY picks up extra pace and trades at shouting distance from the key 91.00 threshold at the beginning of the week. Crude oil prices continue to fluctuate in a relatively tight range on Monday after closing the previous week little changed. A barrel of West Texas Intermediate was up 2.57% on a daily basis.
Technical Analysis:
USDJPY (4 Hour Chart)
USDJPY rose above 105.00 and is trading comfortably above that multi-monthly high price zone. Bouncing back from the worst equity market performance of last week, the market today has seemed to be fueled with investors that are risk positive, which means the safe-haven JPY would lack sufficient demand. Additionally, the greenback has regained some substantial demand as the DXY has risen over the multi-month high of 91.00 despite the upbeat equity market. Given that there will be no major macroeconomic data awaiting to be released on Tuesday that associates with JPY or USD, and that the risk-positive sentiment is likely to persist if nothing major can potentially reverse the ongoing sentiment, it is reasonable to expect the rise of USDJPY would extend.
Technically speaking, the surge of USDJPY is supported by both its 15-Day SMAVG and MACD histogram. However, due to the fact that the RSI for USDJPY has surpassed the overbought region, a downward correction can be expected. On the upside, if the USDJPY can continue to be traded above the 105.00 resistance level, the USDJPY bulls can cap their gains on 105.21 zone. On the flip side, the bears are eyeing critical support levels at 104.62, 104.30, and 104.07.
Resistance: 105.00, 105.21, 105.38
Support: 104.62, 104.30, 104.07
GBPUSD (4 Hour Chart)
GBPUSD topped above 1.3755 in the late European session but gradually tumbled and bottomed at 1.3657 in the American session. Although there is a shortage of fundamental news in the market, it is inferable that the sudden decrease in the GBPUSD pricing may be a result of the bears failing to advance above the key 1.3761 resistance. Given that the 1.3761 resistance is a multi-year high price level, the bulls’ failure to extend the pair’s bullish trend offered the bears an opportunity to place additional short-selling positions that ultimately pull down the Cable’s price. Not to mention the fact that a recent rise in DXY also contributed to the plummet of GBPUSD. From a technical perspective, the GBPUSD is still supported by the 15-Day SMAVG; however, as the RSI is dipping down to the low 40s, the selloff trend in the pair seems to have formed, but the duration may not be too long, and that is because the upcoming BoE Interest Rate decision is expected to be left unchanged, which in turn, can resume the rally of GBPUSD.
Resistance: 1.3731, 1.3745, 1.3761
Support: 1.3693, 1.3645, 1.3606
XAUUSD (4 Hour Chart)
On Monday, the yellow metal has surged extensively from the lows of $1849 and climbed all the way up to $1871.85 amid a strengthened demand in the greenback. Afterward, the XAUUSD pair failed to advance further and remained consolidative between the $1875 and $1858 range. From a technical perspective, the precious metal is under a bearish pressure as indicated by the 60-Day SMAVG. Additionally, because the surge of XAUUSD is heavily relied on the slumping US 10-year yields on Monday, the bullish run of the pair is choppy. This can be found in the pair’s spinning top candlestick patterns and the 50ish RSI reading of the yellow metal. If the XAUUSD can break above the $1875 resistance, the next resistance level would be near $1891.On the flip side, if the XAUUSD reverses its bullish trend, the first cushion of the pair can be found at $1858, followed by $1850, then around $1843.
Resistance: 1875, 1891, 1906
Support: 1858, 1850, 1843
Economic Data
Click here to view today’s important economic data.


