


BTCUSD Recovery Following Market Dip
Bitcoin (BTC) has shown remarkable resilience, recovering to $80,407.21 after experiencing a sharp decline to a low of $74,496.09 earlier today. This price movement is significant as it highlights Bitcoin’s ability to rebound after testing key levels of support.
Impact of U.S. Tariffs on the Cryptocurrency Market
As U.S. President Trump’s tariffs on all countries went into effect on April 5, with higher, country-specific tariffs scheduled for April 9, markets are bracing for a potential global recession. These measures have affected global sentiment, pushing Bitcoin and other cryptocurrencies lower in the short term.
Bitcoin’s 7% drop over the last 24 hours was driven by growing concerns about the impact of escalating trade tensions on economic stability. These fears have heightened market volatility and led to significant sell-offs across both the traditional and digital asset markets.
Technical Indicators and Market Sentiment
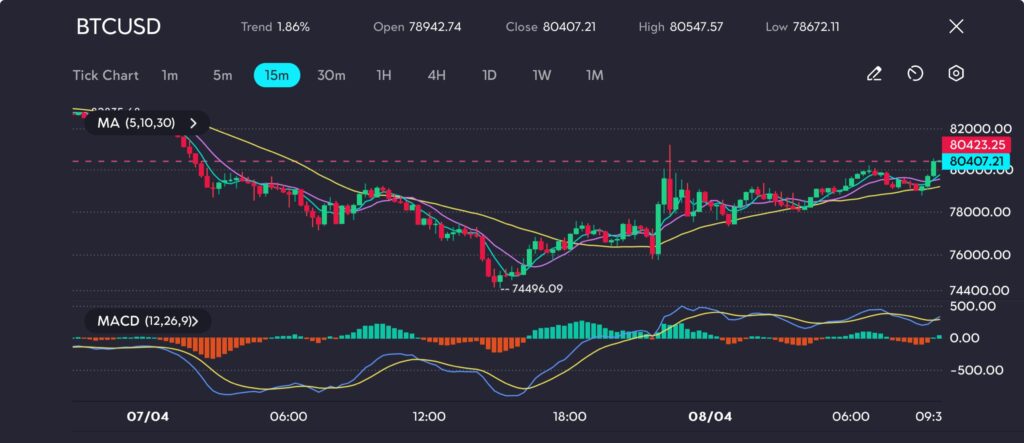
Picture: BTCUSD tests resistance at 80547.57 after significant upward movement from 74496.09, as seen on the VT Markets app.
BTCUSD increased by 1.86%, closing at 80407.21 after opening at 78942.74. The session saw a significant rise, reaching a high of 80547.57 before retracing slightly to close near 80407.21.
BTC’s recovery to $80,407.21 has shown the power of the crypto asset in bouncing back from sharp declines. The cryptocurrency continues to follow the MACD (12,26,9) and moving averages, with the market currently trending upwards by 1.86%.
Key levels to monitor include 80547.57 as immediate resistance and 74496.09 as key support. A break above resistance could signal further upside momentum, while a move below support could suggest potential downside pressure.
Market participants are closely monitoring the death cross signal on Bitcoin’s daily chart, which may indicate further downside risks if the price fails to hold above the current levels. Despite these concerns, some analysts view the current dip as an opportunity to accumulate Bitcoin at lower prices.
Death Cross and Symmetrical Triangle Formation
The death cross seen in BTC’s daily chart suggests that there may be more challenges ahead for Bitcoin, especially if it continues to struggle with breaking key resistance levels. This technical pattern suggests a possible downtrend, with a potential drop to around $54,000 if the price continues to form lower highs and lower lows.
Bitcoin’s recent trading in a symmetrical triangle pattern, which may indicate a breakout soon, though a significant decline to the 50% retracement level at $54,000 remains a possibility.
Altcoin Market Declines
Altcoins such as Ethereum (ETH), Solana (SOL), and XRP have all seen substantial declines, with losses of 17.2%, 16%, and 15.8% respectively in the past 24 hours. These altcoins have been more severely impacted by the broader market sell-off and are still in recovery.
An Opportunity to Stack Bitcoin?
Despite the ongoing market turbulence and uncertainty caused by U.S. tariffs and the potential for a recession, some traders see the current dip in Bitcoin prices as an opportunity to accumulate more Bitcoin. If Bitcoin falls between the $65,000 to $71,000 range, it could offer an attractive buying opportunity.
With Bitcoin trading at $80,407.21 at press time, the potential for further upside remains, particularly if the broader market finds stability or if the global trade situation begins to improve.
Market Outlook
As Bitcoin continues to show recovery, traders will remain on edge as the tariff situation develops. Tariff impacts, rising inflation fears, and potential rate cuts from central banks could continue to influence Bitcoin’s price action.
Traders and market participants alike are advised to monitor Bitcoin’s technical levels closely, as any breakdown below current support could lead to further volatility. Conversely, a sustained move above $80,000 could trigger a positive shift for Bitcoin in the short term
اکنون تجارت را شروع کنید – برای ایجاد حساب VT Markets زنده خود اینجا را کلیک کنید


